
NOAK Full Results
Drilling Cost Model: GeoVision Correlation (Temperature-adjusted Ideal)
View these graphs with well depth on the x-axis →
Metric Graphs
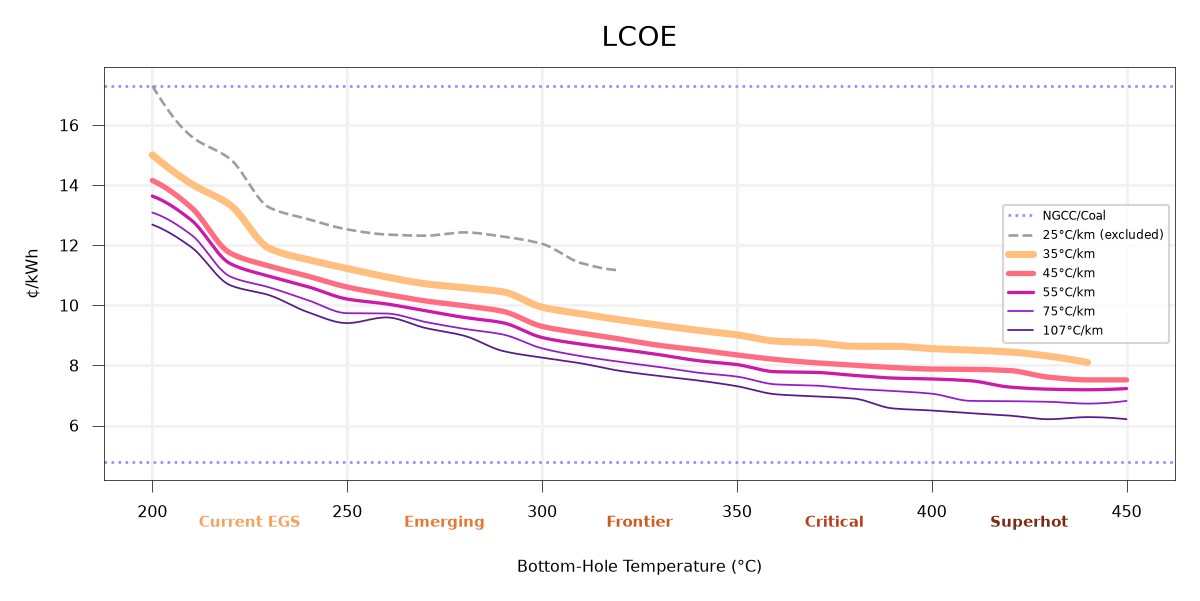
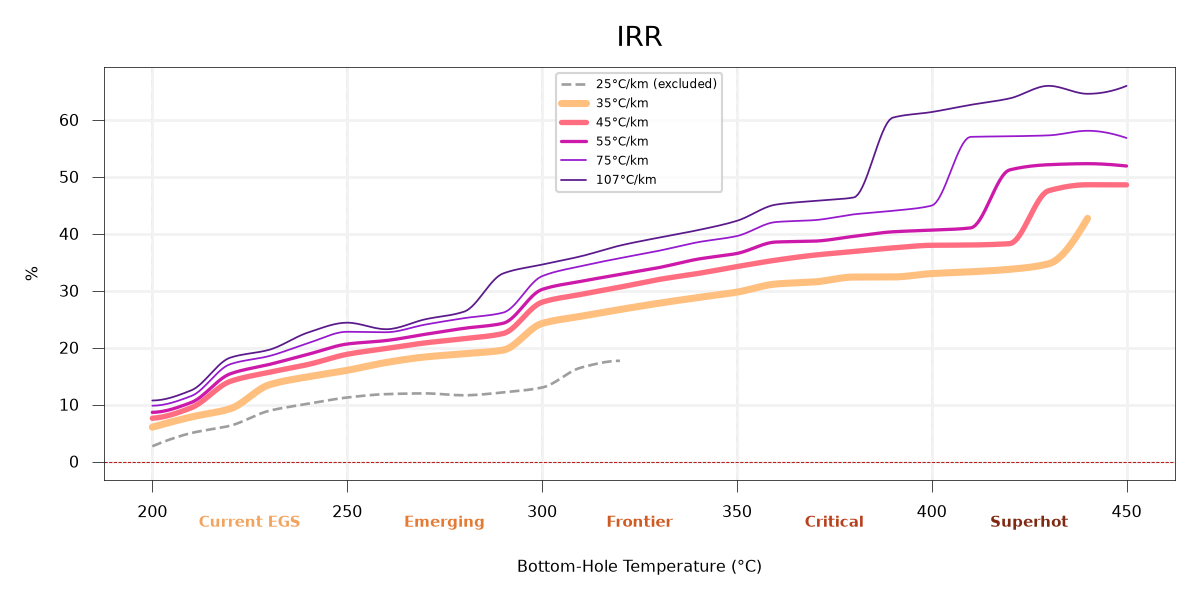
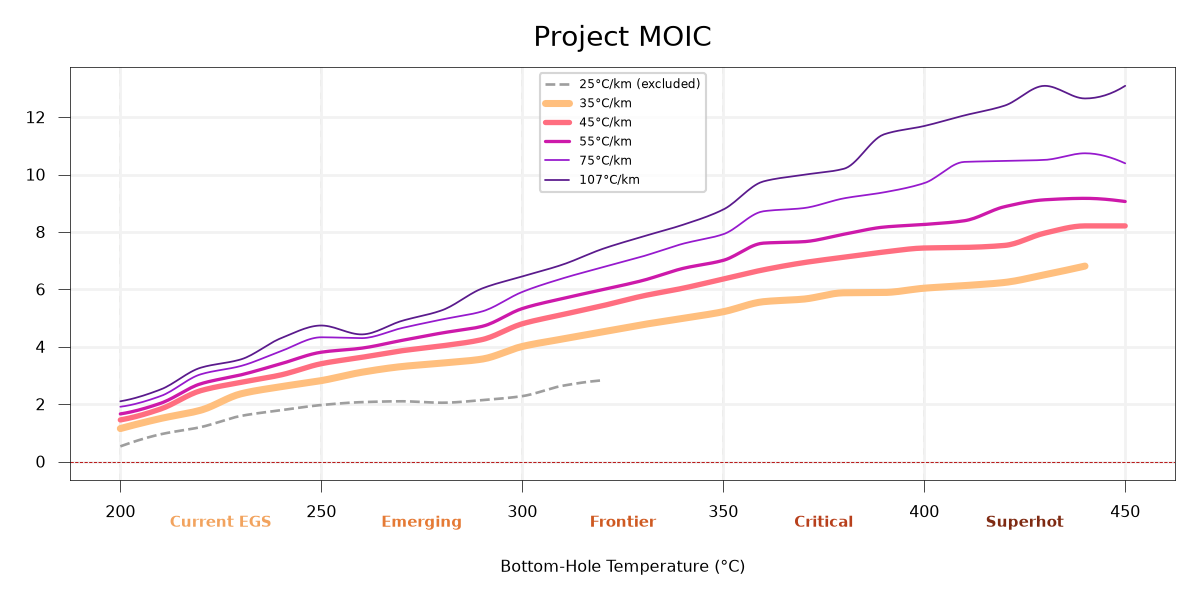
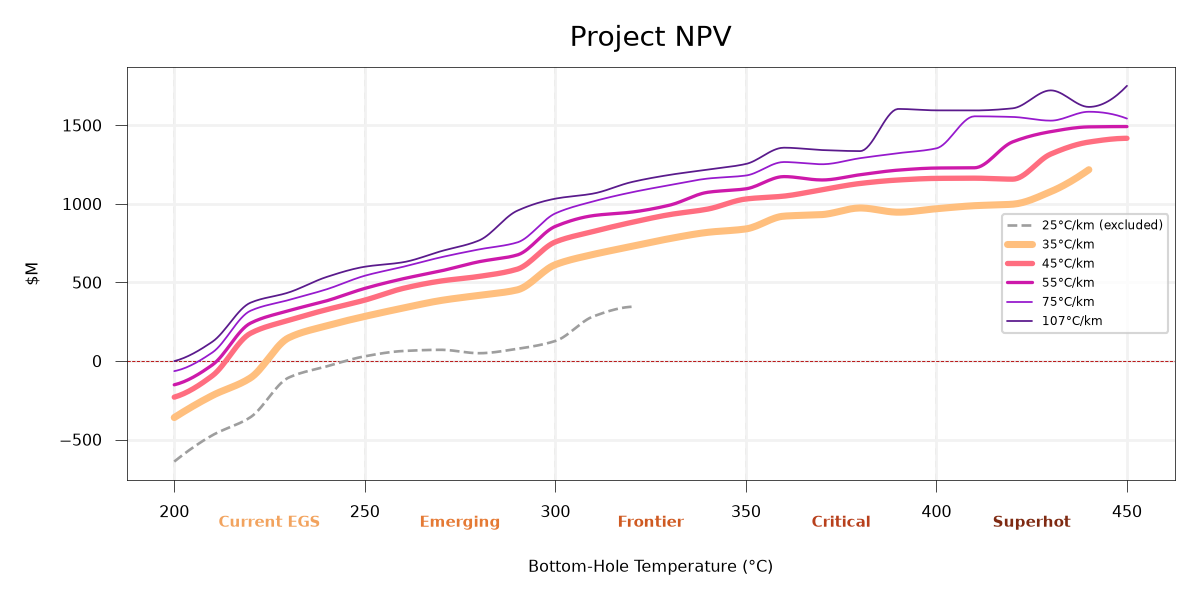
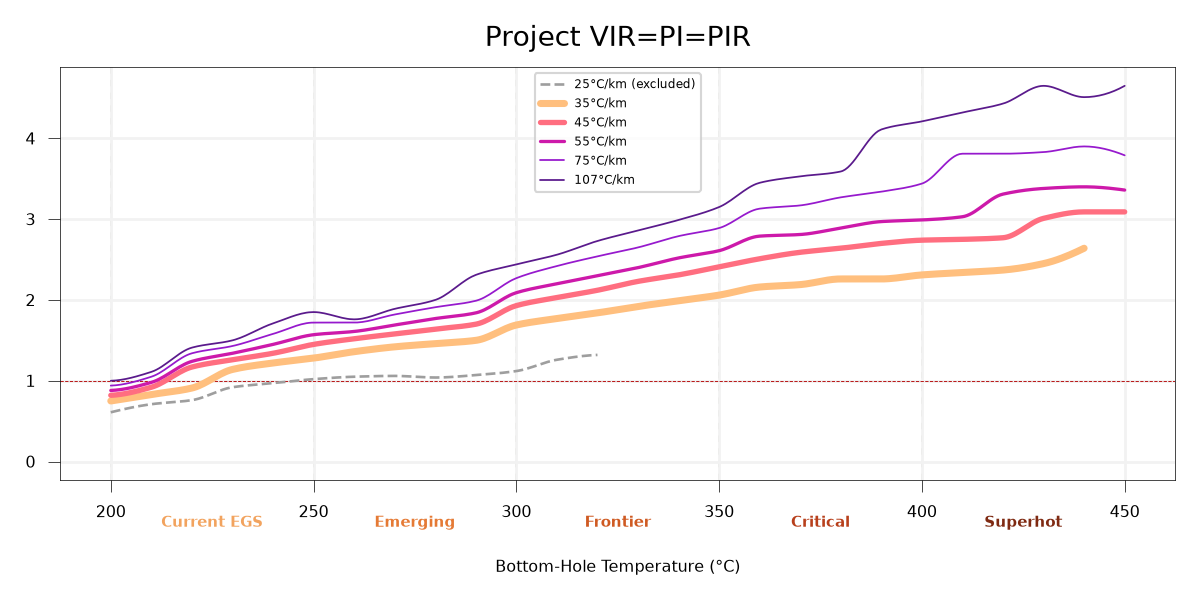
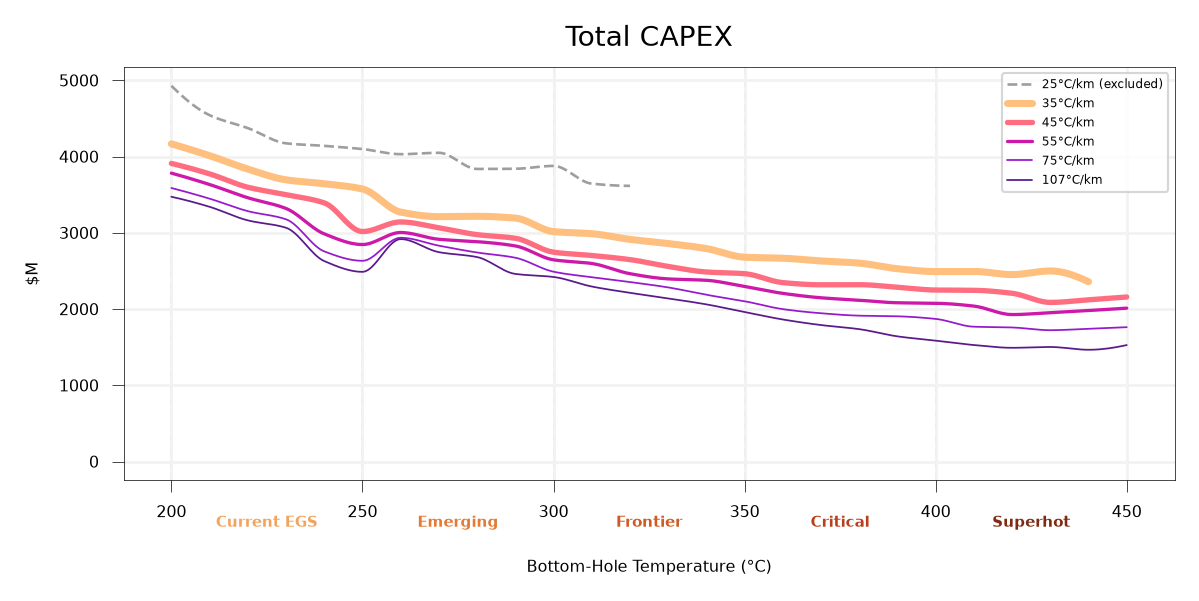
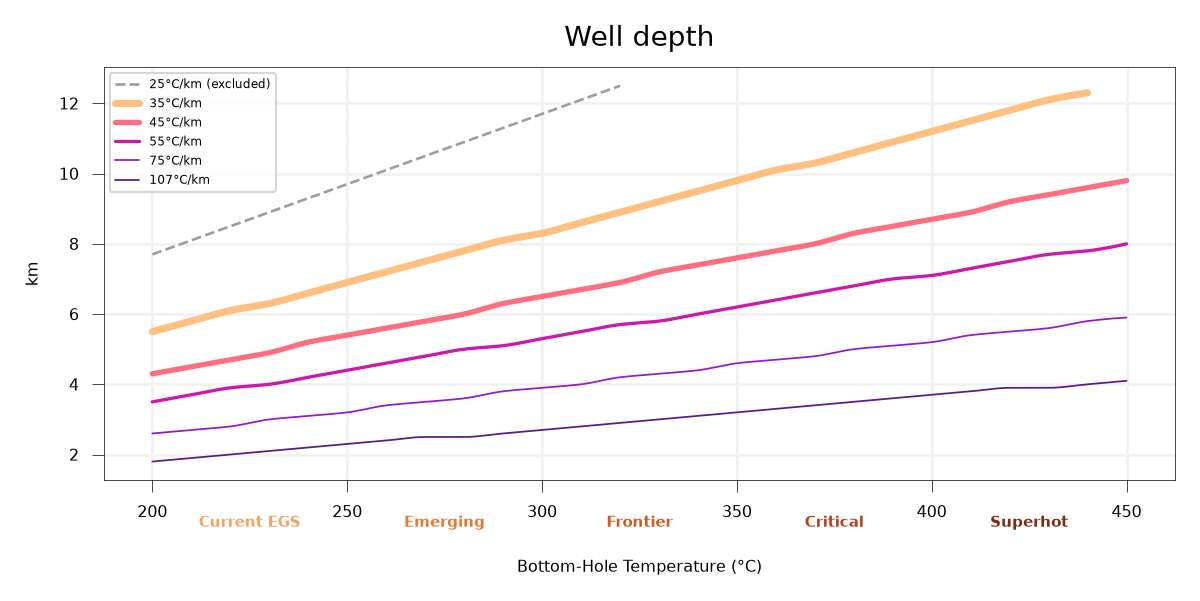
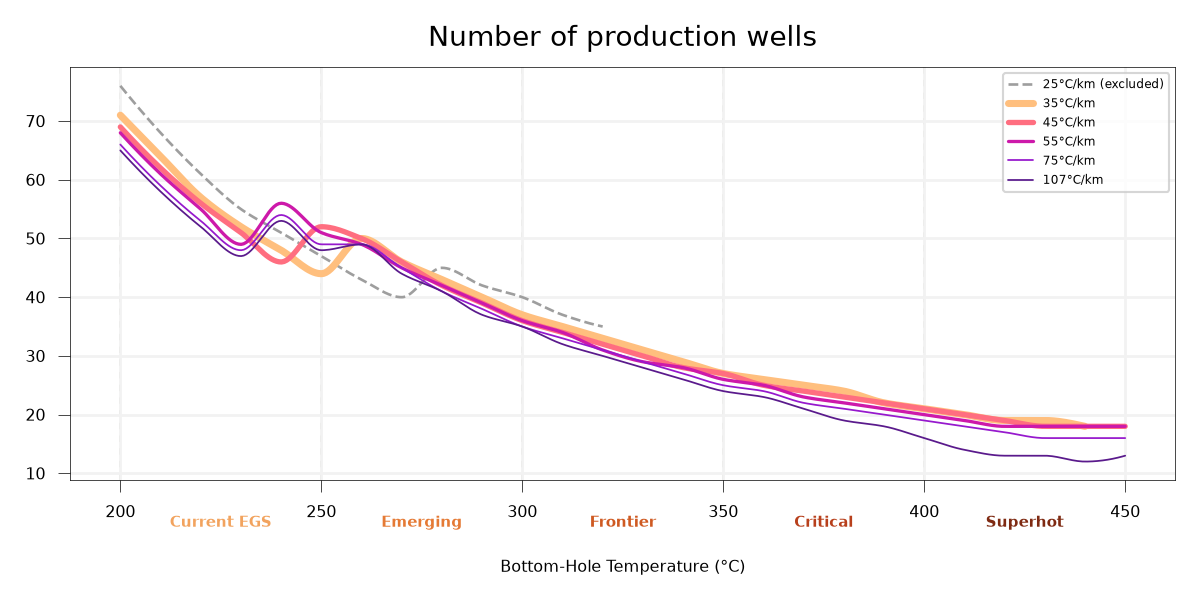
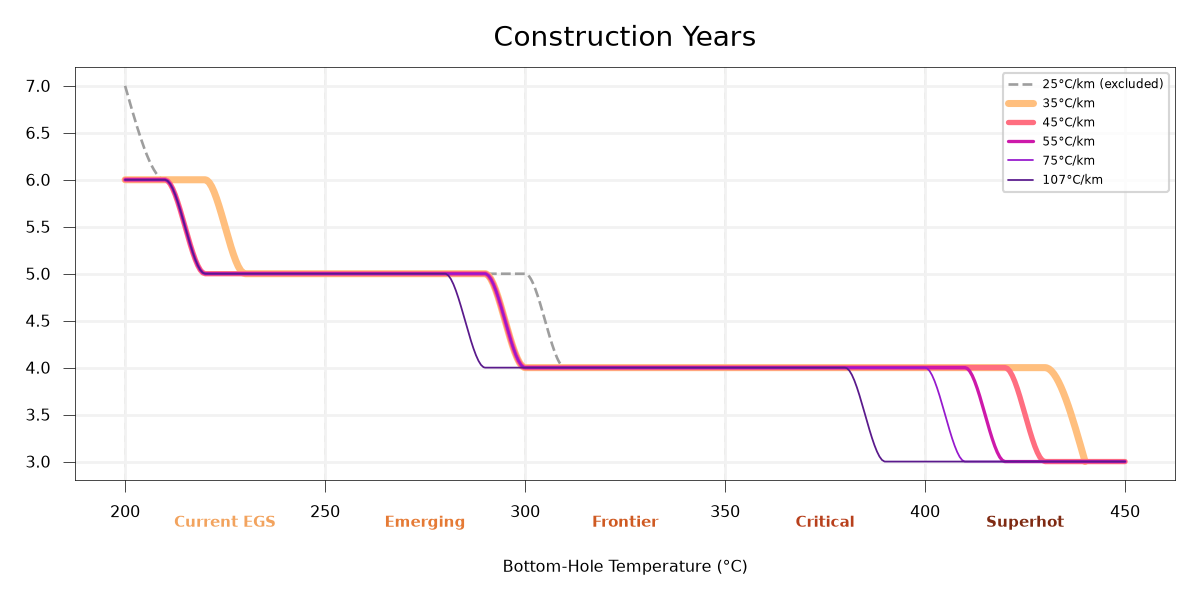
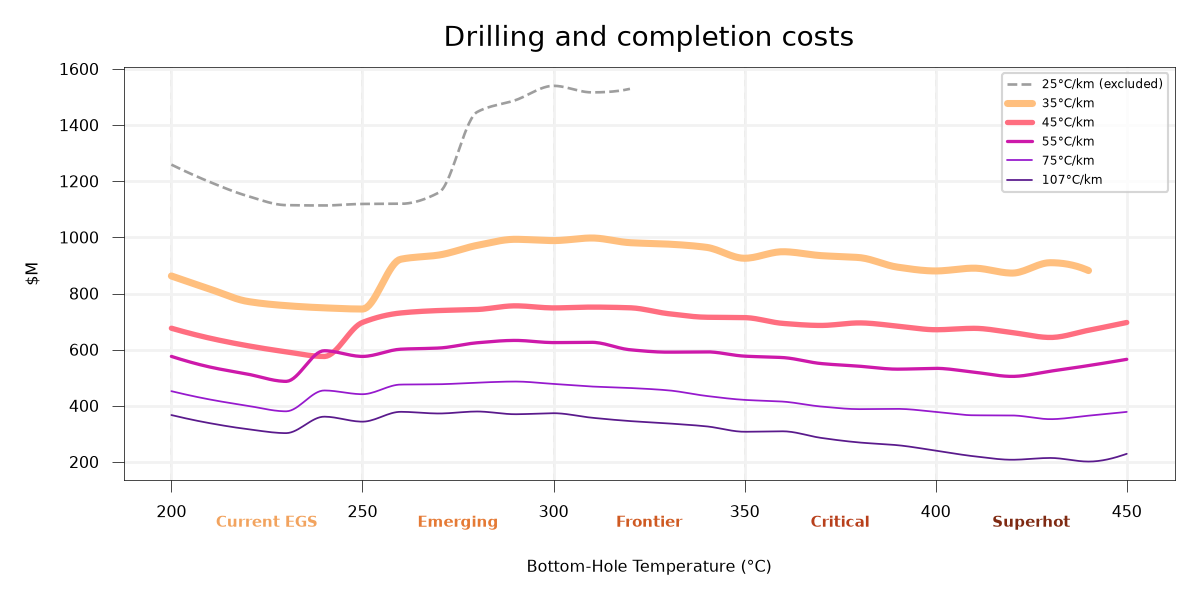
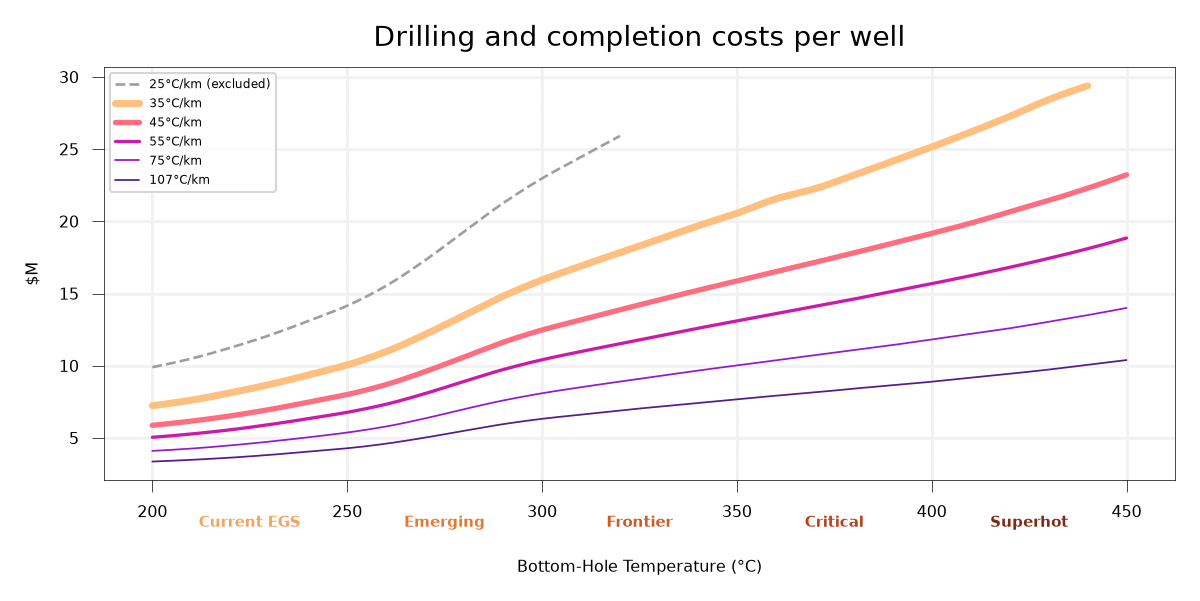
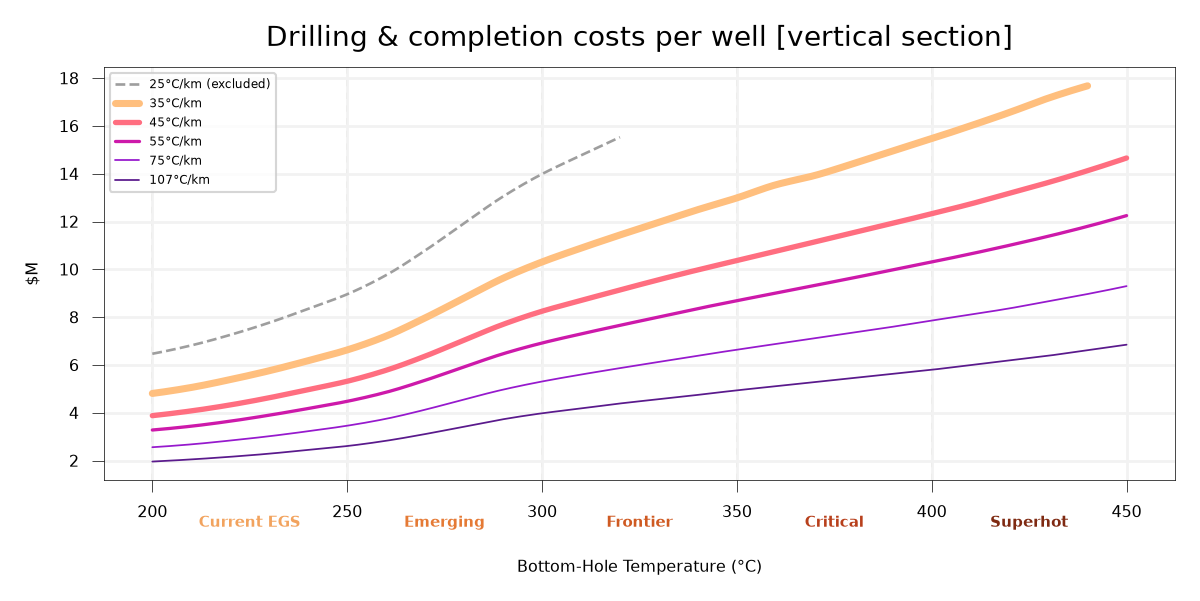
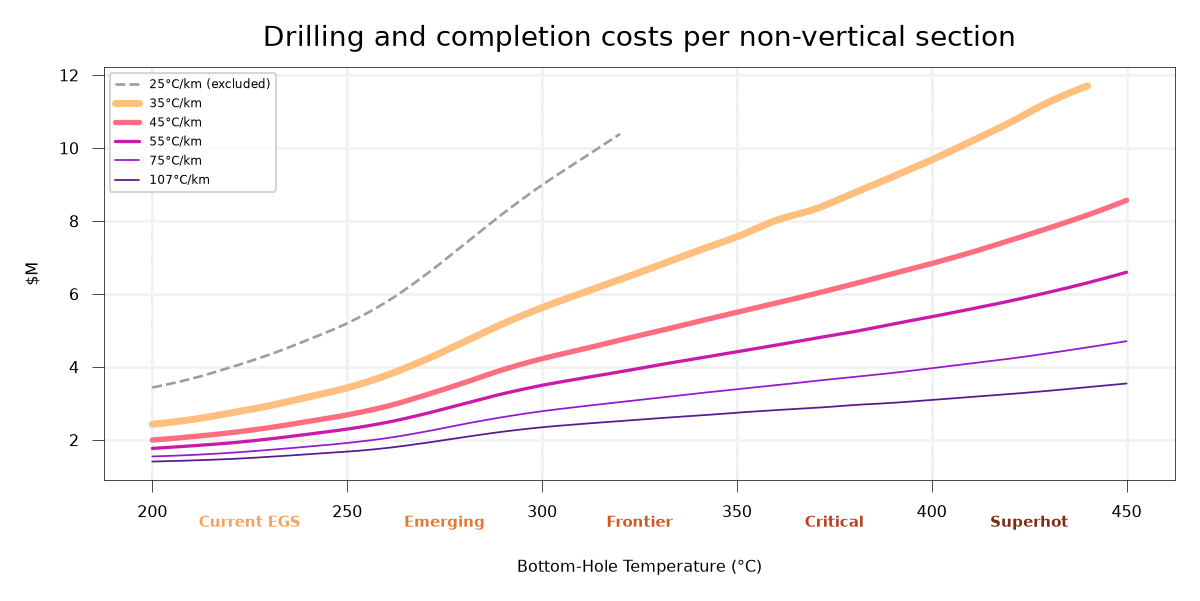
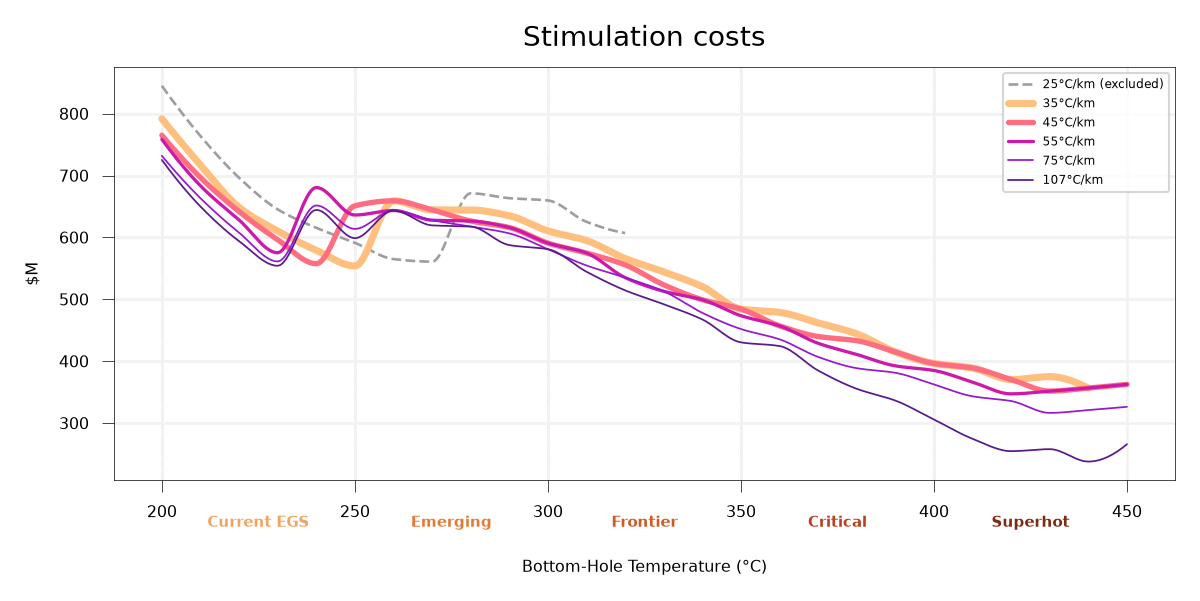
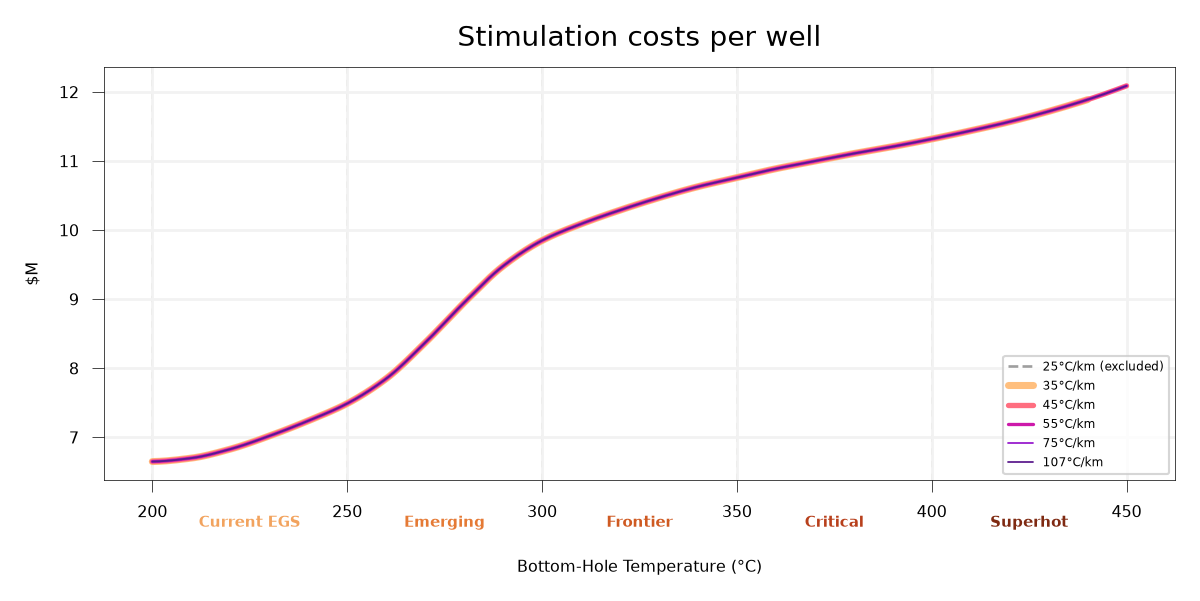
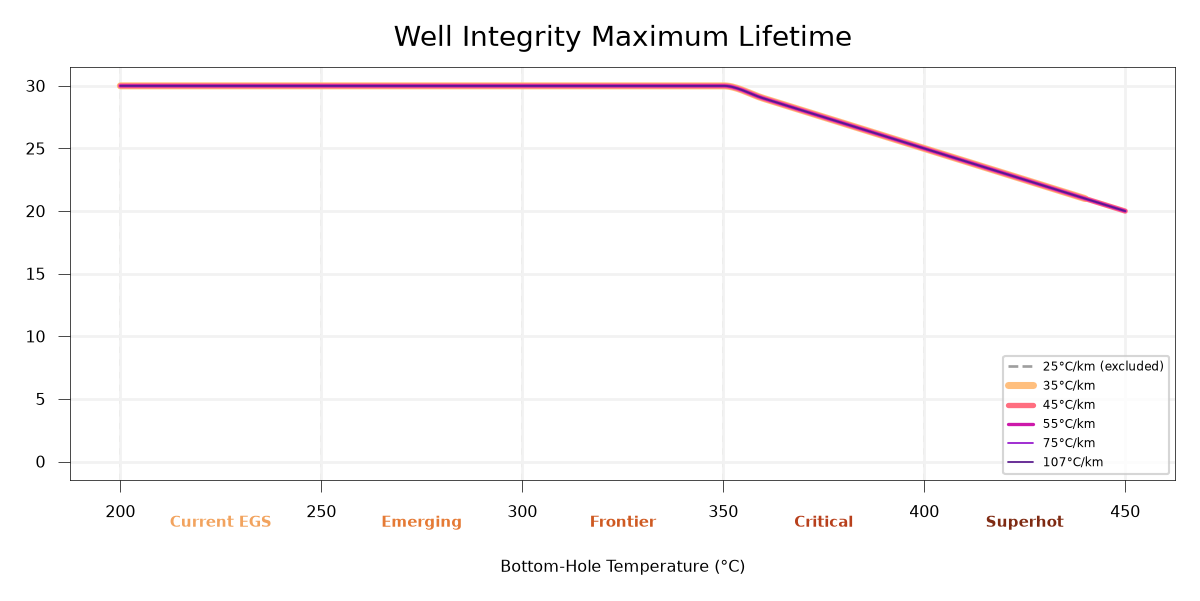
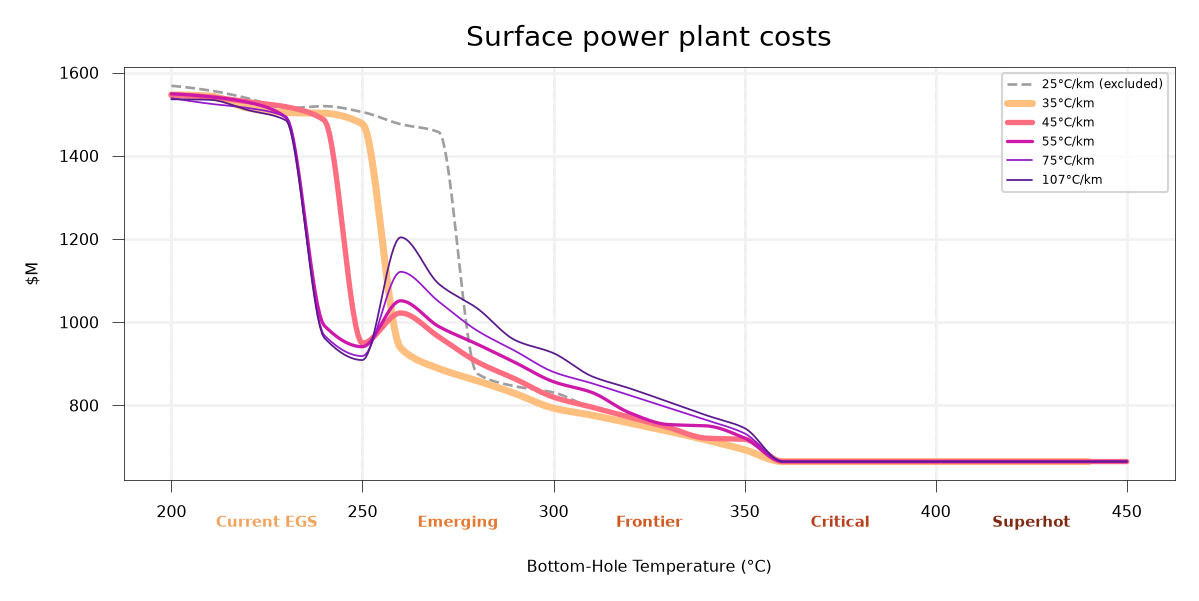
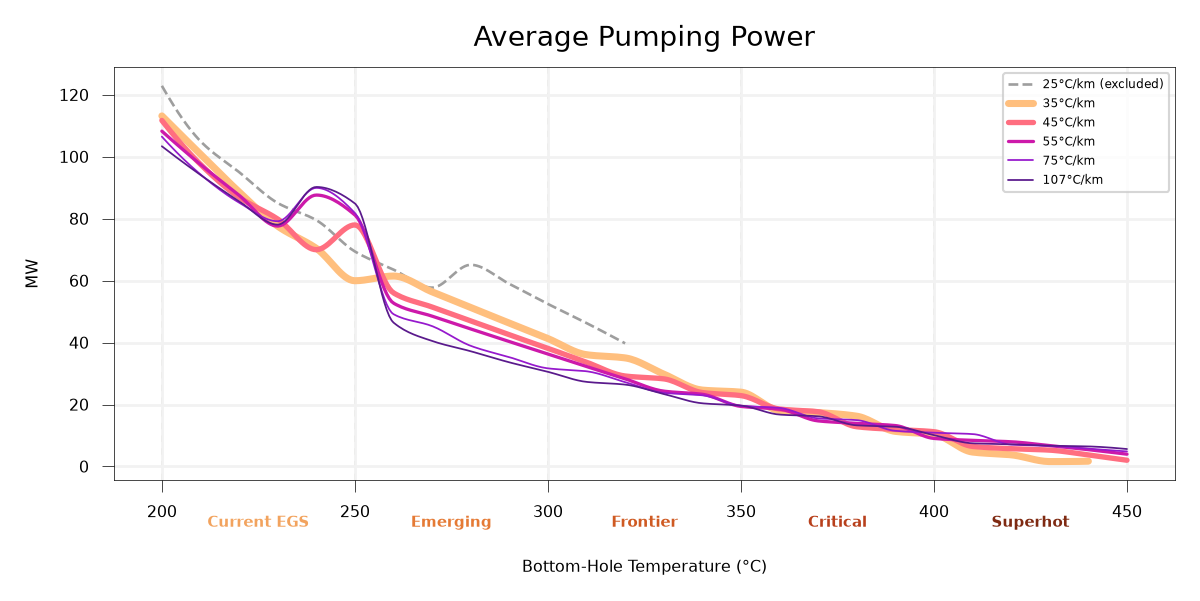
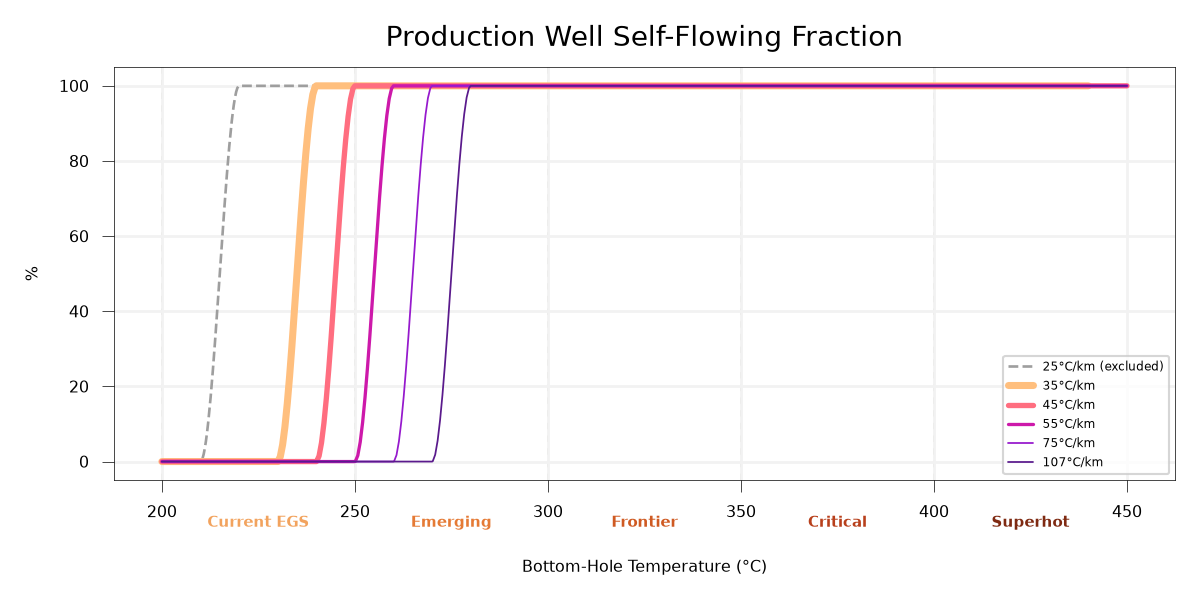
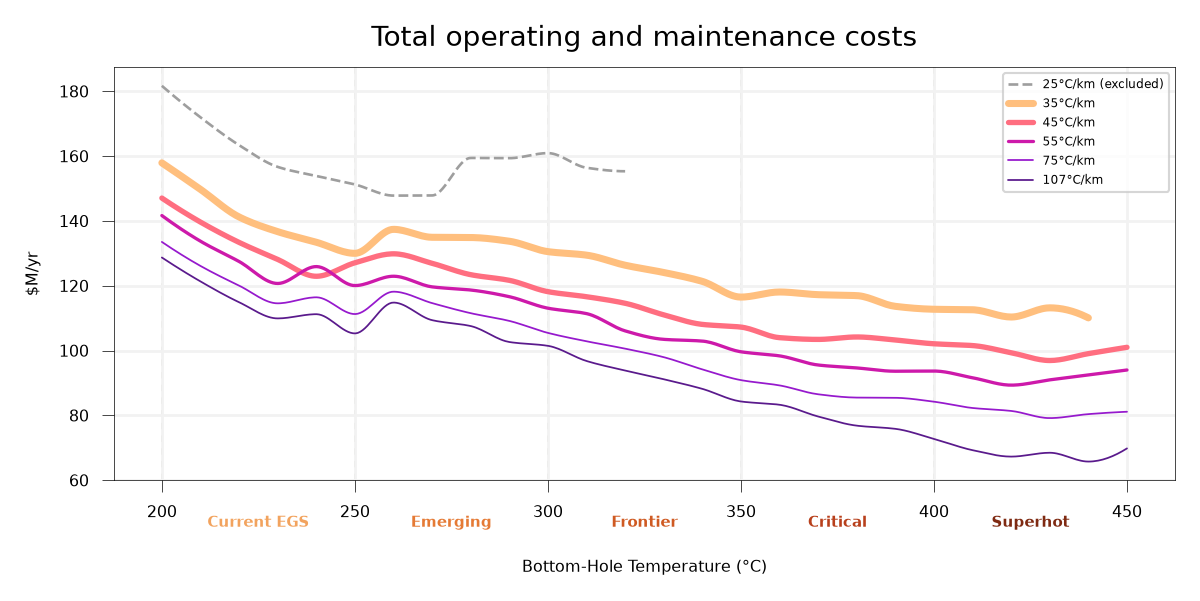
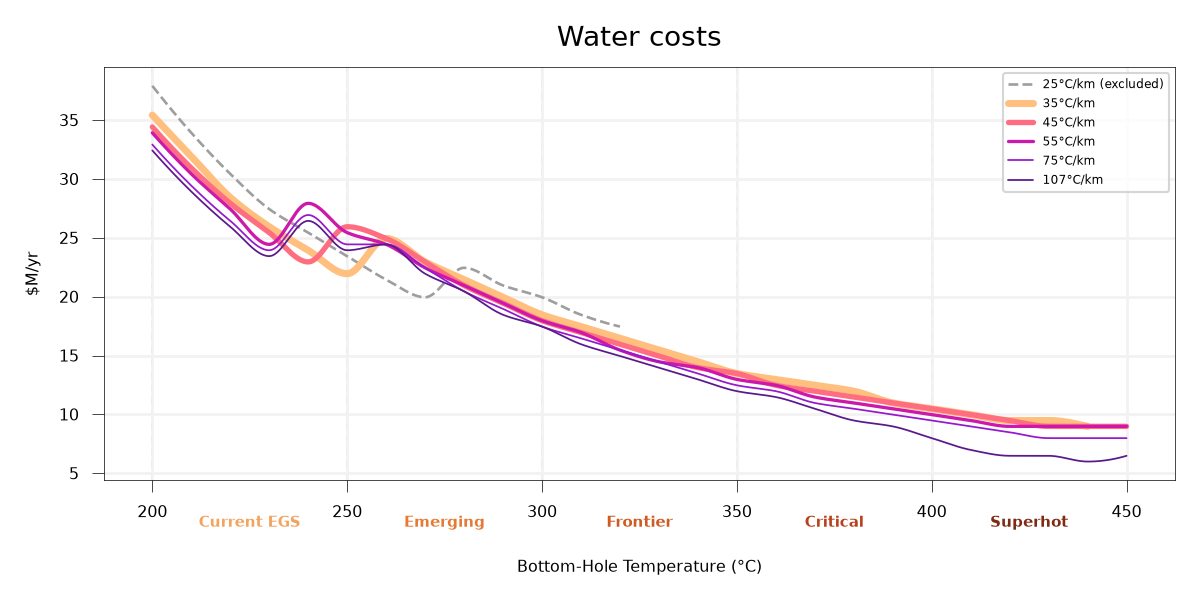
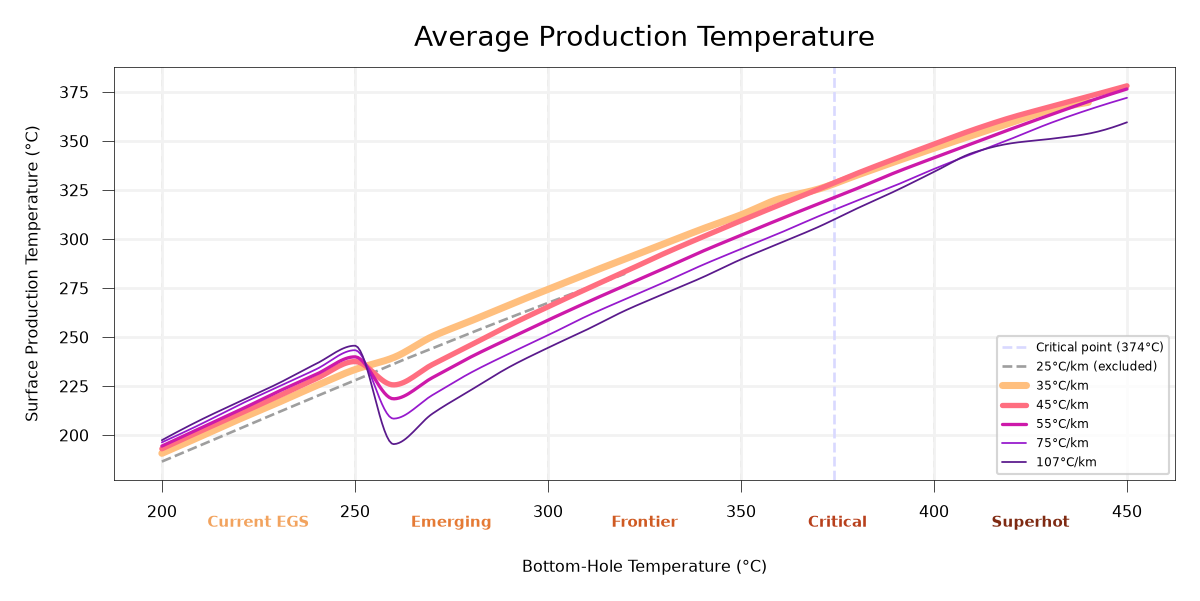
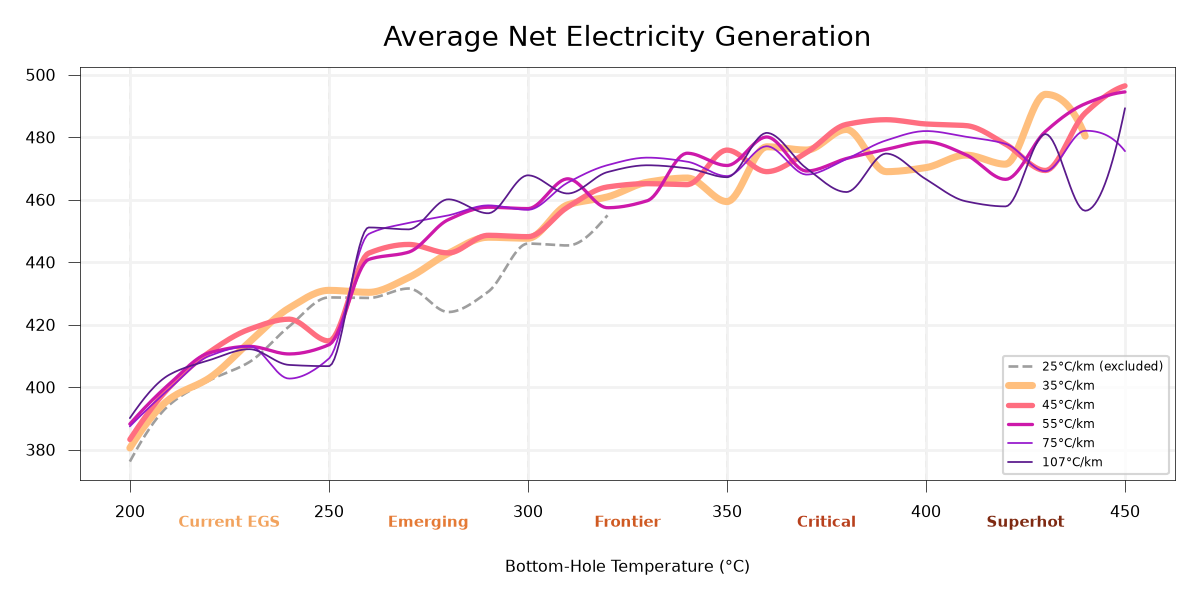
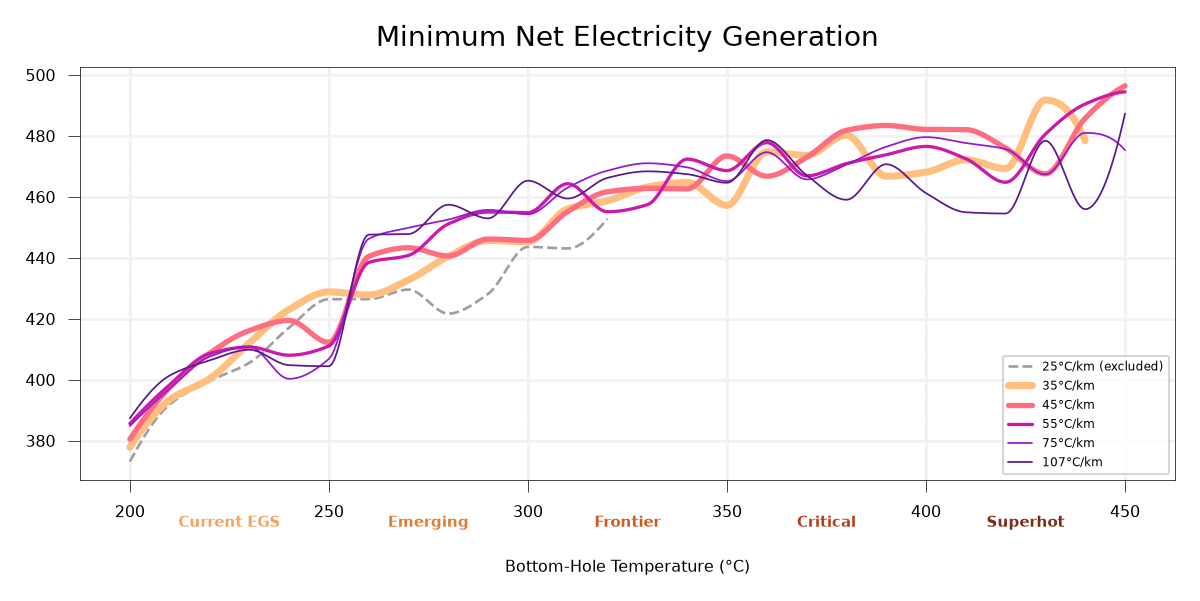
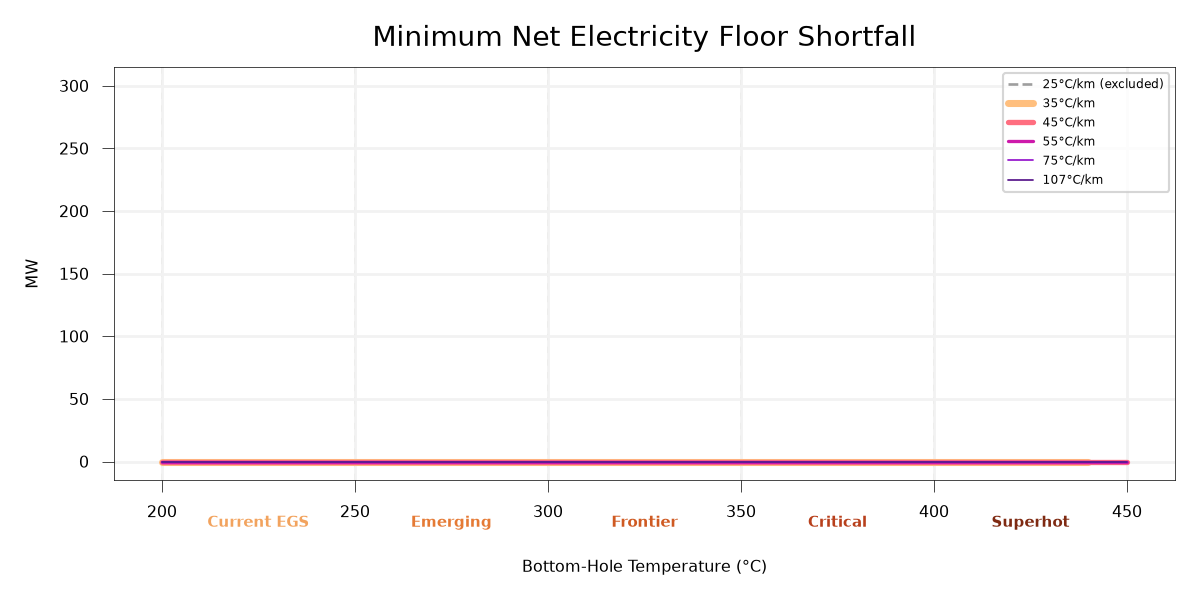
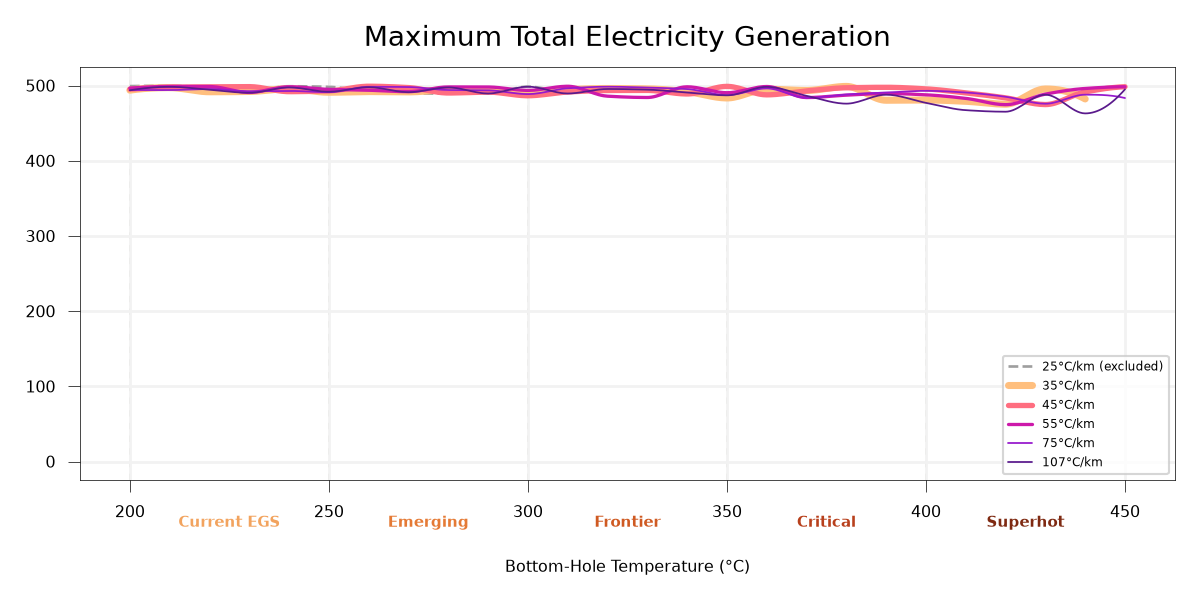
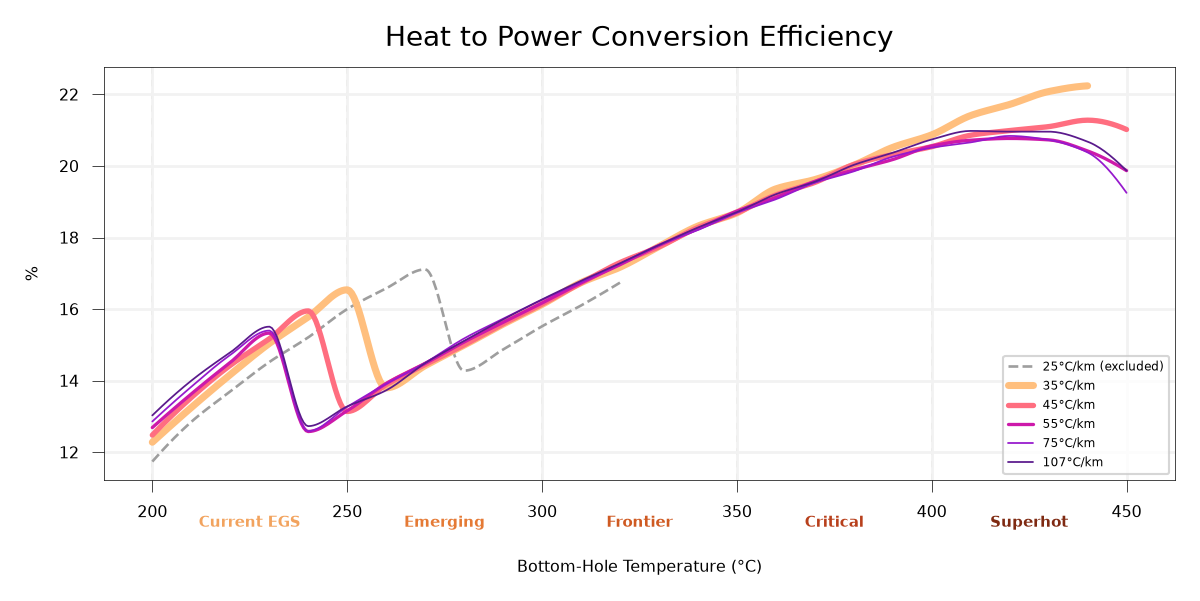
LCOE Table
Electricity breakeven price (in cents/kWh) by gradient and bottom-hole temperature. Click any result to view the corresponding GEOPHIRES parameters on SWS GTP.
| Gradient | Bottom-Hole Temperature | |||||||||||||||||||||||||
|---|---|---|---|---|---|---|---|---|---|---|---|---|---|---|---|---|---|---|---|---|---|---|---|---|---|---|
| 200°C | 210°C | 220°C | 230°C | 240°C | 250°C | 260°C | 270°C | 280°C | 290°C | 300°C | 310°C | 320°C | 330°C | 340°C | 350°C | 360°C | 370°C | 380°C | 390°C | 400°C | 410°C | 420°C | 430°C | 440°C | 450°C | |
| 25.0°C/km | 17.31 | 15.63 | 14.87 | 13.26 | 12.87 | 12.53 | 12.36 | 12.32 | 12.43 | 12.29 | 12.05 | 11.41 | 11.17 | |||||||||||||
| 35.0°C/km | 15.01 | 14.05 | 13.34 | 11.9 | 11.52 | 11.23 | 10.95 | 10.72 | 10.59 | 10.45 | 9.94 | 9.72 | 9.52 | 9.34 | 9.17 | 9.02 | 8.81 | 8.76 | 8.64 | 8.64 | 8.56 | 8.51 | 8.45 | 8.31 | 8.1 | |
| 45.0°C/km | 14.16 | 13.26 | 11.74 | 11.31 | 10.97 | 10.61 | 10.37 | 10.15 | 9.99 | 9.8 | 9.3 | 9.08 | 8.88 | 8.67 | 8.52 | 8.35 | 8.2 | 8.09 | 8.01 | 7.93 | 7.88 | 7.87 | 7.83 | 7.61 | 7.52 | 7.52 |
| 55.0°C/km | 13.64 | 12.84 | 11.39 | 10.97 | 10.62 | 10.21 | 10.05 | 9.82 | 9.6 | 9.42 | 8.93 | 8.71 | 8.54 | 8.36 | 8.16 | 8.03 | 7.79 | 7.77 | 7.67 | 7.58 | 7.55 | 7.49 | 7.28 | 7.21 | 7.19 | 7.23 |
| 75.0°C/km | 13.09 | 12.35 | 10.96 | 10.6 | 10.17 | 9.74 | 9.73 | 9.45 | 9.22 | 9.03 | 8.57 | 8.31 | 8.12 | 7.95 | 7.76 | 7.63 | 7.37 | 7.33 | 7.22 | 7.15 | 7.06 | 6.82 | 6.81 | 6.79 | 6.73 | 6.82 |
| 107.0°C/km | 12.69 | 11.94 | 10.67 | 10.34 | 9.77 | 9.41 | 9.6 | 9.25 | 8.99 | 8.48 | 8.26 | 8.07 | 7.82 | 7.65 | 7.5 | 7.31 | 7.04 | 6.97 | 6.9 | 6.57 | 6.5 | 6.41 | 6.33 | 6.21 | 6.28 | 6.21 |
Configuration Settings
| Setting | Value | Comment |
|---|---|---|
| Drilling Cost Model | NOAK: Adjusted VERTICAL_LARGE_IDEAL Correlation | |
| Target Maximum Electricity Production | 500 MW | |
| Flowrate per well | 80 kg/s | |
| Lateral length | 1473.825 m | |
| Fracture separation | 9.8255 | Per Norbeck et al., 2024 lateral length is 4700 ft = 1432 m. Dividing 1432 by 80 = ~18 m fracture spacing. |
| Fracture height | 205.0 | Empirically derived value that results in 1 redrill for NOAK scenarios (overrides base fracture height of 174.64 m) |
| Surface Temperature | 8 degC | |
| Production Tax Credit Electricity | 0 | https://programs.dsireusa.org/system/program/detail/734 |
| Investment Tax Credit Rate | 0.3 | Statutory rate for geothermal energy property meeting the prevailing wage and apprenticeship requirements (IRC §48/§48E), as in the GEOPHIRES Fervo_Project_Cape-7 case study |
| Power Plant Type | 4 | Double-Flash |
| Surface Plant Capital Cost Adjustment Factor | 1.13 | Applied for BHT 200-359C. Based on comparison with CATF case study (Brown et al., 2024) |
| Redrilling Learning Rate | 0.05 | Each doubling of the number of wellfields drilled at the site cuts the cost of the next by 5%, so the first redrill costs 95% of the original wellfield and the eighth 85%. Lower than FOAK: a mature industry has less to learn at a new site, and on its mature-technology cost basis faster drilling saves less, with halving drilling time cutting the ideal-scenario well cost by about 7% (Lowry et al., 2017). Drilling time in mature Texas oil and gas fields falls about 3% per doubling of wells (Kellogg, 2009). |
| Discount Rate | 0.075 | |
| Injectivity Index | 2.1858750000000002 | |
| Productivity Index | 1.8081500000000001 | |
| Reservoir Model | 1 | Multiple Parallel Fractures Model (Gringarten et al., 1975) |
| Reservoir Density | 2800 | |
| Reservoir Heat Capacity | 790 | |
| Reservoir Thermal Conductivity | 3.05 | |
| Reservoir Porosity | 0.0118 | |
| Reservoir Volume Option | 1 | FRAC_NUM_SEP: calculate heat-in-place based on realistic fracture geometry. Number of Fractures calculated in code. |
| Fracture Shape | 3 | Square (Congruent with Gringarten) |
| Number of Segments | 1 | |
| Maximum Temperature | 600 | |
| Number of Injection Wells per Production Well | 0.666 | Modeled on the reference case 5-well bench pattern (3 producers : 2 injectors) described in Singh et al., 2025. |
| Well Geometry Configuration | 4 | L (required for lateral costing) |
| Multilaterals Cased | True | EGS laterals are cased and cemented for plug-and-perf multistage stimulation (Norbeck et al., 2024), as in the GEOPHIRES Fervo_Project_Cape-7 case study. GEOPHIRES otherwise halves the lateral cost (All-in Nonvertical Drilling Costs, set per scenario from the drilling cost model). |
| Maximum Drawdown | 0.0025 | Models potential thermal breakthrough requiring redrilling in conjunction with reservoir volume & fracture geometry |
| Production Well Diameter | 7.825 | Inner diameter of 8⅝ inch, 36 lb/ft casing: Fervo disclosed 8⅝ inch casing for its 3.0 well design (up from 7 inch in Cape Station Phase I) (Fervo Energy Q2 2026 results, 2026-08-12), as in the GEOPHIRES Fervo_Project_Cape-7 case study. The previous value (8.535 in, 9⅝ inch casing) was inferred from a less specific announcement. |
| Injection Well Diameter | 7.825 | See Production Well Diameter |
| Injection Temperature | 60 | |
| Injection Wellbore Temperature Gain | 3 | |
| Ramey Production Wellbore Model | True | |
| End-Use Option | 1 | |
| Utilization Factor | .9 | |
| Water Loss Fraction | 0.2375 | Average of 14.5-33% range (Clark et al., 2010) |
| Ambient Temperature | 10 | |
| Plant Lifetime | 25 | |
| Circulation Pump Efficiency | 0.80 | |
| Plant Outlet Pressure | 1 atm | |
| Construction CAPEX Schedule | 0.014 | 0.027,0.139,0.431,0.389, Matches Fervo_Project_Cape-5 |
| Construction Years | 5 | Matches Fervo_Project_Cape-5; TODO to adjust for number of wells |
| Economic Model | 5 | SAM Single Owner PPA |
| Starting Electricity Sale Price | 0.115 | Midpoint of the $100-130/MWh range Fervo Energy reports for contracts under negotiation, about half of them with hyperscale data center buyers (Fervo Energy Q2 2026 results, 2026-08-12), as in the GEOPHIRES Fervo_Project_Cape-7 case study. Above the prices implied by existing contracts, e.g. Corsac Station's 15-year PPA at $107/MWh (CTVC, 2025). |
| Electricity Escalation Rate Per Year | 0.00183 | $1.83/MWh per year, linear: reproduces the 15-year present value of a 1.5%/year compounding escalator on $115/MWh (the escalator in Ormat's 2025 Heber 1 PPA; CTVC, 2025), as in Fervo_Project_Cape-7. |
| Electricity Escalation Start Year | 0 | First escalation step in the second operating year (a PPA escalating from the first anniversary of commercial operation). |
| Ending Electricity Sale Price | 0.1406 | Caps escalation at the operating-year-15 price ($140.6/MWh): held flat after a 15-year PPA term, as in Fervo_Project_Cape-7. |
| Fraction of Investment in Bonds | .62 | As in the GEOPHIRES Fervo_Project_Cape-7 case study (October 2026 Update), which sizes debt for a minimum pre-tax debt service coverage ratio of at least 1.35, the 2024b ATB geothermal value (NREL, 2025), at an 18-year Debt Tenor. A uniform convention here: debt is not re-sized for each scenario's cash flows. |
| Debt Tenor | 18 | The 2024b ATB debt amortization assumption and the SAM default (NREL, 2025), as in Fervo_Project_Cape-7. Without it, GEOPHIRES amortizes debt over the full Plant Lifetime. |
| Inflated Bond Interest Rate | .07 | 2024b ATB (NREL) |
| Inflated Bond Interest Rate During Construction | 0.105 | Higher than interest rate during normal operation to account for increased risk of default prior to COD. Value aligns with ATB discount rate (NREL, 2025). |
| Bond Financing Start Year | -2 yr | Equity-only for first 2 construction years (ATB) |
| Inflation Rate | .03 | US CPI-U was 3.4% year over year in July 2026 (core 2.5%) (BLS, 2026); 3.0% is between core and headline, as in the GEOPHIRES Fervo_Project_Cape-7 case study. Note: [2024b ATB models lower inflation](https://atb.nrel.gov/electricity/2024b/definitions#inflation). |
| Combined Income Tax Rate | 0.2487 | Assumed average for the western states in scope: 21% federal corporate income tax plus the average state corporate income tax. |
| Property Tax Rate | 0.0071 | Assumed average effective property tax rate for the western states in scope. |
| Depreciation Schedule | 2 | 5-year MACRS, the statutory depreciation class for facilities that claim the technology-neutral clean electricity credits (IRC sections 48E and 45Y) (Norton Rose Fulbright, 2025), as in Fervo_Project_Cape-7. Assumes the owner can use the early-year tax losses (e.g. through tax equity), as the 2024b ATB does (NREL, 2025); allocating the entire depreciable basis to 5-year MACRS slightly overstates the benefit (Fervo_Project_Cape-7: about 0.4 percentage points of IRR). Without it, GEOPHIRES uses 20-year straight line. |
| Royalty Rate | 0.0175 | BLM geothermal royalty on federal leases, which hold most western geothermal resources: 1.75% of gross proceeds from electricity sales for the first 10 years of production (Code of Federal Regulations, 2024), as in the GEOPHIRES Fervo_Project_Cape-7 case study. |
| Royalty Rate Escalation Start Year | 11 | After the first 10 years of production, the royalty rate escalates to 3.5%. |
| Royalty Rate Escalation | 0.0175 | |
| Royalty Rate Maximum | 0.035 | |
| One-time Flat License Fees Etc | 213 | Grid interconnection (point-of-interconnection facilities plus network upgrades) for the 500 MW plant at $426/kW, the average for recent 250-750 MW interconnection requests across PacifiCorp, BPA and Duke (Seel et al., 2026, Generator Interconnection Costs to the Transmission System in non-ISO Balancing Authorities, LBNL). A nominal, non-site-specific value; the GEOPHIRES Fervo_Project_Cape-7 case study uses $500/kW for PacifiCorp network resource interconnection in southern Utah. GEOPHIRES adds it to capital cost without indirect or contingency loading and includes it in the ITC basis, which overstates the credit slightly (qualified interconnection property is eligible only for energy property of 5 MW or less); not modeled either: refunds of network upgrade costs after commercial operation, common in non-ISO balancing authorities. |
| Annual License Fees Etc | 12.3 | Long-term firm point-to-point transmission service for 500 MW at about $24,500/MW-year, BPA's rate for fiscal years 2026-2028 ($2.043/kW-month) (BPA, 2025, BP-26 Transmission Rate Schedules), the comparison rate cited in Fervo_Project_Cape-7. Previously $10M/year at the fiscal year 2024-2025 rate ($1.648/kW-month). A nominal value: Fervo_Project_Cape-7 (October 2026 Update) uses PacifiCorp's OATT formula rate effective June 2025 ($27M/year); delivery across an intervening system would add a second reservation. Held flat in nominal terms by GEOPHIRES. |
| Reservoir Stimulation Capital Cost per Fracture Surface Area | 0.87431693989 | Derived from the GEOPHIRES Cape Station case study's baseline stimulation cost of $4.0M, which is calibrated from high-intensity U.S. shale well analogues (~$39k/frac stage for 102 stages). This is a pre-contingency value and excludes EGS-specific cost premiums such as ceramic proppant and HPHT hardware. |
| Reservoir Stimulation Capital Cost per Production Well | -1 | Indicates both production and injection wells are stimulated. (See Reservoir Stimulation Capital Cost per Fracture Surface Area.) |
| Field Gathering System Capital Cost Adjustment Factor | 0.339 | Gathering costs represent 2% of facilities CAPEX per https://www.linkedin.com/pulse/fervo-energy-technology-day-2024-entering-geothermal-decade-matson-n4stc/ |
| Time steps per year | 12 | |
| Print Output to Console | 0 |